Hi, I'm Serena โ a Data School Coach at The Information Lab, sharing Tableau tips, tricks and dashboards with the wider datafam community.
From personal passion projects to #MakeoverMonday remakes and practice dashboards โ click through to explore the full, interactive portfolio.
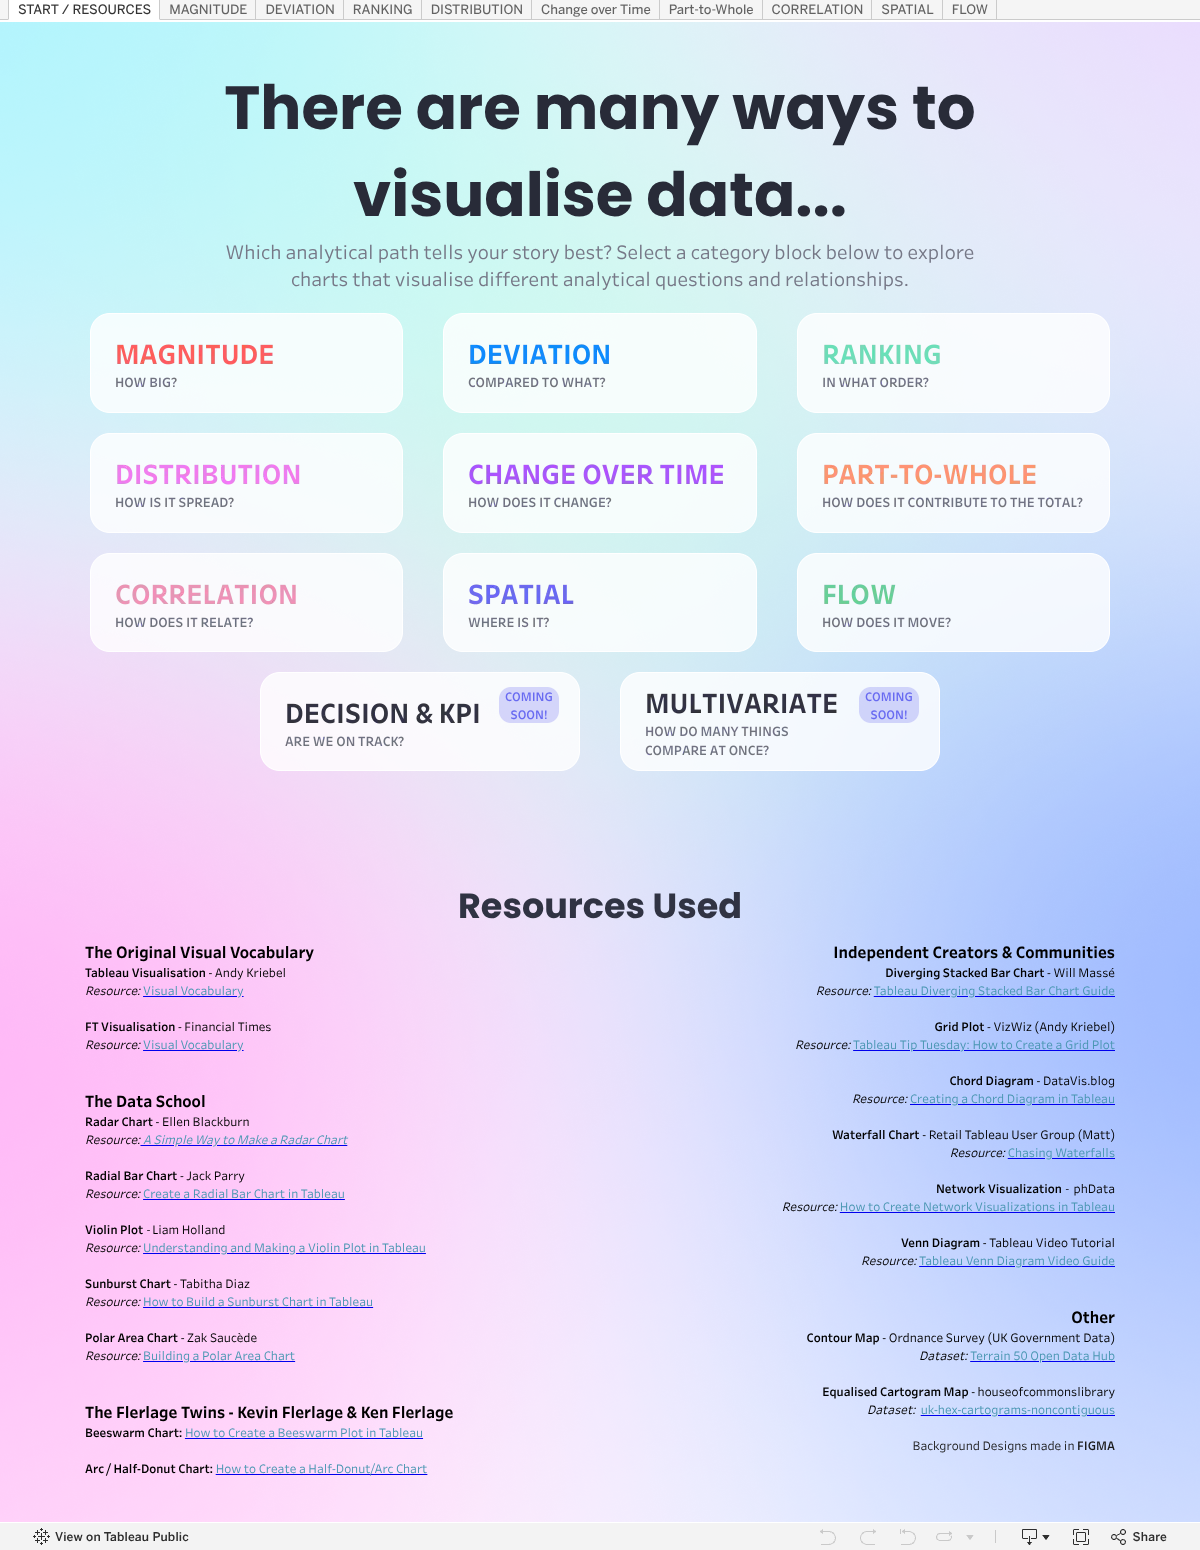
An interactive guide to 70+ chart types, organised by the analytical question they answer.
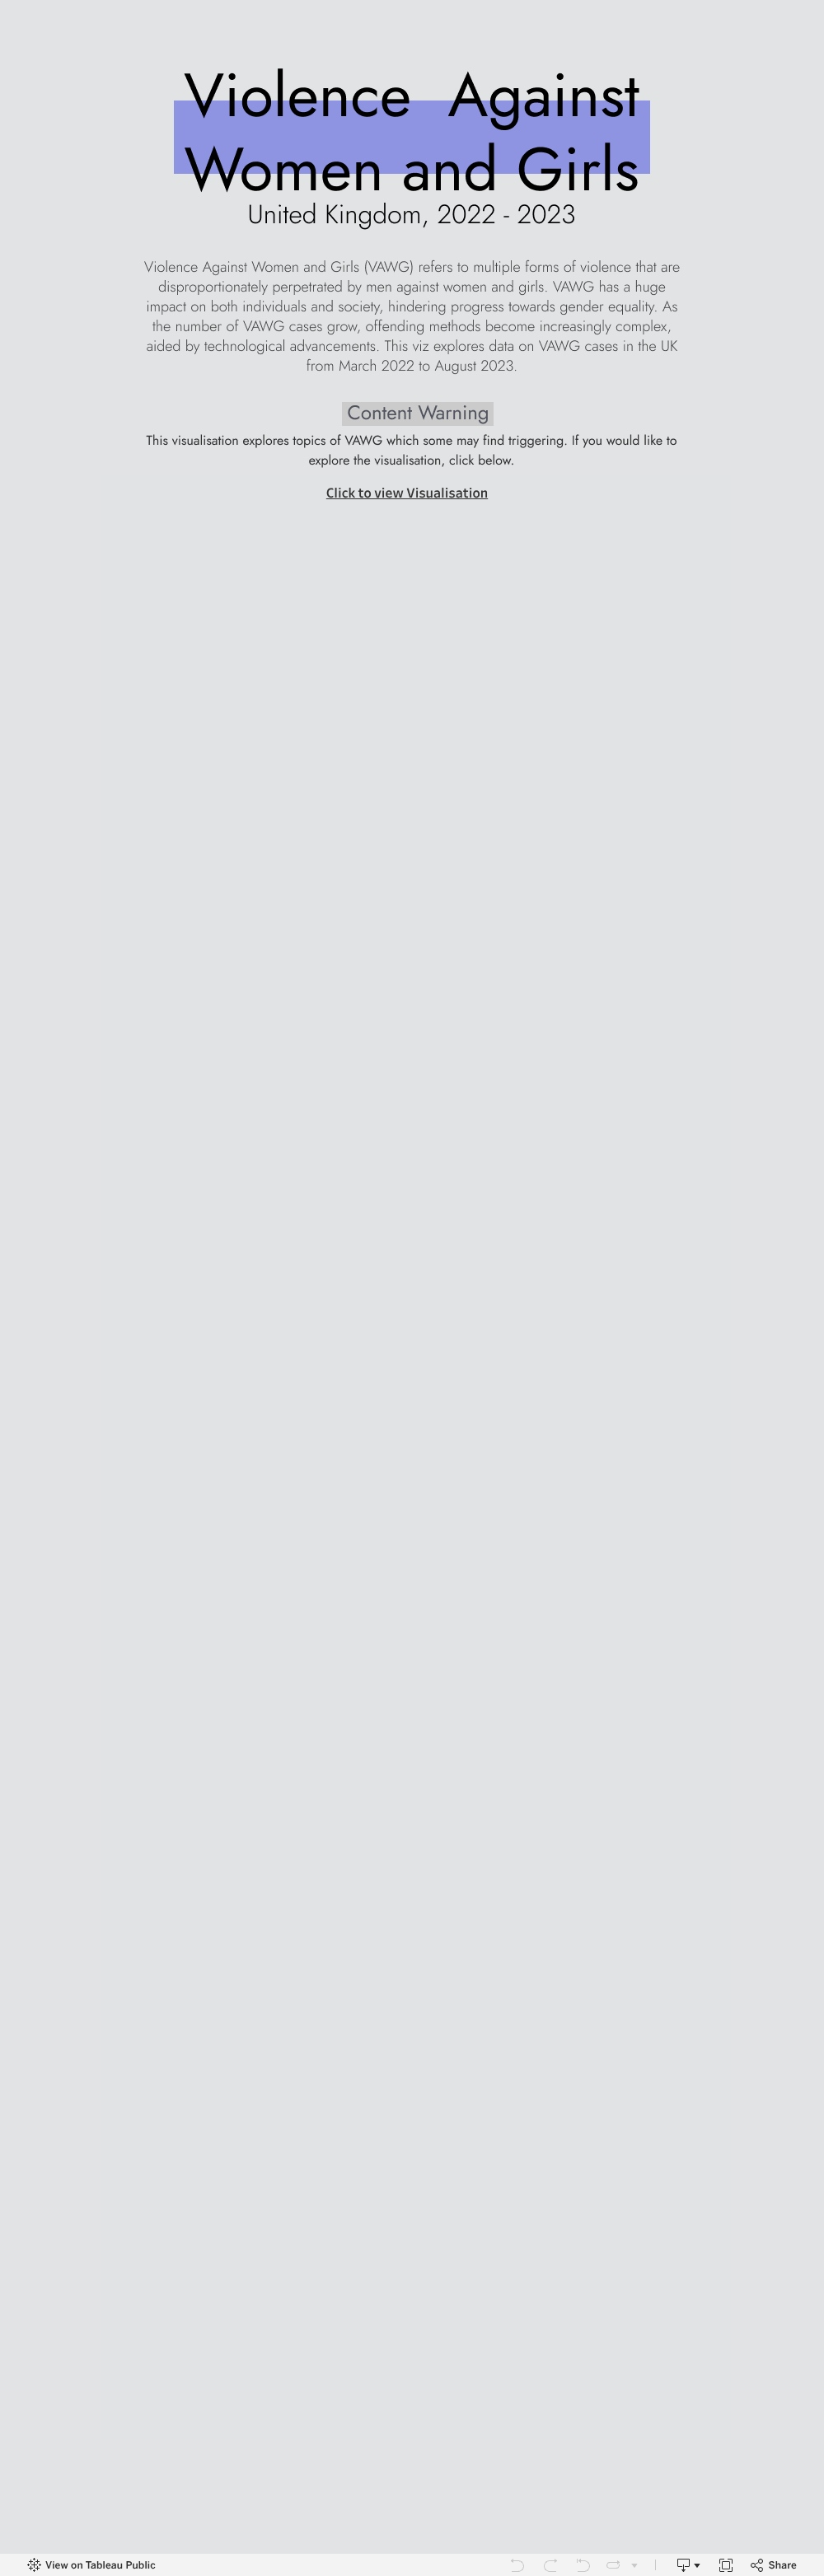
Exploring patterns in Violence Against Women and Girls data across England & Wales.
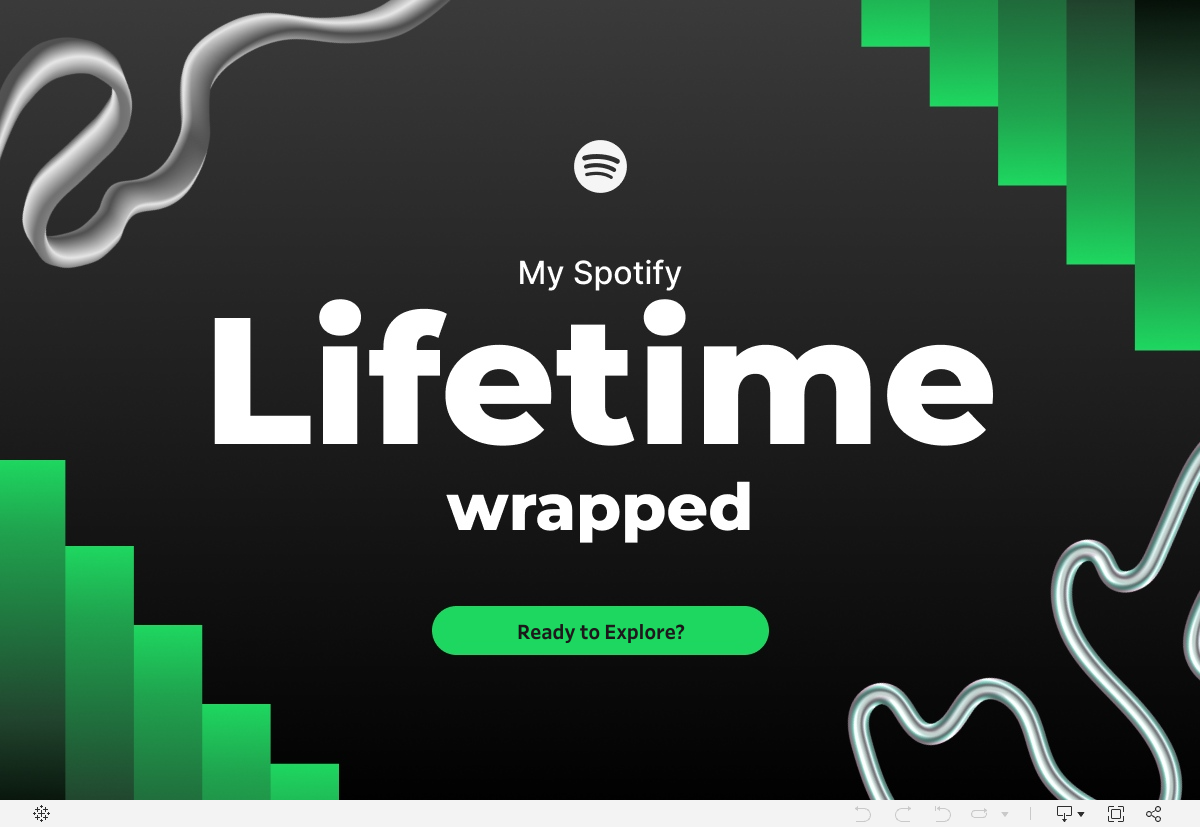
A personal deep-dive into years of Spotify listening history, Wrapped-style.
Bite-sized Tableau tips, tricks and community features โ helping the datafam grow together.
Learn how to create a basic Funnel Chart in Tableau Desktop!
TipDid you know you can drag fields in and out of Tableau's calculation editor? A simple trick for testing logic and building YTD calcs.
TipColour by two fields in Tableau without losing the first โ a simple hack plus a Shift-drag shortcut.
Got a Tableau question, a collaboration idea, or just want to say hi to the datafam? Drop me a message.